Semaglutide Before and After: What to Expect, How to Track Progress, and How Dose Influences Results
Introduction
Semaglutide is a prescription glucagon‑like peptide‑1 (GLP‑1) receptor agonist that has been approved in many countries for chronic weight management in adults with obesity or overweight + at least one weight‑related comorbidity. In clinical practice it is administered once weekly as a sub‑cutaneous injection. Because the medication works by reducing appetite, slowing gastric emptying, and improving insulin sensitivity, many patients experience visible changes in body composition within weeks of starting therapy.
“Before‑and‑after” photos, weight charts, and laboratory trends have become a familiar way for people to visualize what the medication can achieve and to set personal expectations. While the images can be motivating, they also risk oversimplifying a complex, individualized process.
The purpose of this article is to give a clear, evidence‑based picture of typical outcomes with semaglutide, explain how the dosing schedule influences those outcomes, and provide practical tools for documenting and interpreting your own before‑and‑after progress safely. All information is presented in an educational tone, with references to the products we dispense for clinical use, and with a focus on the global adult audience seeking medically supervised weight loss.
Key Takeaways
- Real‑world results vary, but clinical trials show an average 15 %‑20 % body‑weight loss after 68 weeks of 1 mg weekly.
- Dose titration (0.25 → 0.5 → 1 mg) helps manage side‑effects and gradually unlocks the full weight‑loss potential.
- Before‑and‑after documentation should use consistent photos, scales, and measurements for an accurate picture.
- Safety monitoring and regular follow‑up are essential; most side‑effects are mild and improve with dose escalation.
- Lifestyle support (nutrition, activity, behavioral coaching) amplifies the visual and metabolic changes seen with semaglutide.
1. What “Before & After” Means in the Context of Semaglutide
1.1 Defining “Before‑and‑After”
In the setting of weight‑management therapy, “before‑and‑after” is more than a side‑by‑side photo. A comprehensive assessment typically includes:
| Parameter | How It’s Measured | Clinical Meaning |
|---|---|---|
| Weight | Digital scale, same time of day, minimal clothing | Primary outcome in most trials |
| Body‑Mass Index (BMI) | Weight (kg) ÷ height (m²) | Helps classify obesity severity |
| Waist Circumference | Tape measure at the level of the iliac crests | Proxy for visceral fat |
| Photographs | Standardized lighting, same pose, same clothing | Visual documentation of body‑shape change |
| Metabolic Labs | HbA1c, fasting glucose, lipid panel, blood pressure | Reflect systemic benefits beyond weight |
1.2 How Clinicians Document Progress
- Baseline visit – full physical exam, labs, and a set of standardized photos.
- Weekly or bi‑weekly weigh‑ins – recorded in the electronic health record (EHR).
- Monthly waist measurements – captured with the same tape and technique.
- Quarterly labs – to monitor glucose, lipids, and renal function.
These data points generate a visual and numerical “before‑and‑after” timeline that can be shared with the patient, the care team, and, when appropriate, used for research or quality‑improvement purposes.
1.3 Importance of Consistency
Inconsistent documentation can create misleading impressions:
- Lighting: Harsh shadows or bright sunlight may exaggerate or hide contours.
- Clothing: Tight or loose garments change the apparent shape.
- Scale calibration: An un‑calibrated scale can add or subtract a kilogram or more.
- Timing: Weighing after a large meal versus after an overnight fast yields different numbers.
For the most reliable “before‑and‑after” record, aim to photograph and weigh yourself at the same time of day (ideally in the morning after voiding), wearing the same outfit, and using the same scale and measuring tape each visit.
2. How Semaglutide Works: The GLP‑1 Connection
2.1 GLP‑1 Receptor Agonism – A Simple Overview
GLP‑1 is an incretin hormone released from the gut after eating. It signals the brain to feel full, slows gastric emptying, and stimulates insulin release while reducing glucagon. Semaglutide mimics these actions, producing three key effects for weight loss:
- Appetite suppression – patients report feeling less hungry and more satisfied after smaller meals.
- Delayed gastric emptying – food stays longer in the stomach, extending the sensation of fullness.
- Improved insulin sensitivity – helps glucose homeostasis, which can reduce cravings linked to blood‑sugar swings.
2.2 From Hormone to Visible Change
When calorie intake falls consistently, the body begins to use stored adipose tissue for energy. Over weeks to months this manifests as:
- Weight reduction – usually 0.5–1 kg per week during the most active phase.
- Waist‑circumference shrinkage – visceral fat is metabolically active and often responds early.
- Improved biomarkers – lower HbA1c, reduced triglycerides, and modest blood‑pressure drops.
These changes are the “after” component that patients can see in the mirror and on the scale.
2.3 Duration of Action & Weekly Dosing
Semaglutide has a half‑life of approximately 1 week, allowing stable plasma concentrations with a single weekly injection. The long‑acting profile avoids the peaks and troughs that can cause fluctuating appetite, making the weight‑loss trajectory smoother and more predictable over time.
3. Clinical Evidence: Average Before‑After Results from Trials
3.1 Key Phase III Studies
| Study (Year) | Dose | Participants (n) | Mean % Body‑Weight Loss at 68 weeks | Mean Waist Reduction (cm) | HbA1c Change (Δ%) |
|---|---|---|---|---|---|
| STEP‑1 (2021) | 2.4 mg (investigational) | 1,210 | 14.9 % | –10.5 | –0.9 |
| STEP‑2 (2021) | 1 mg | 1,210 (obesity + type 2 DM) | 9.6 % | –8.8 | –1.0 |
| STEP‑5 (2022) | 1 mg | 304 | 15.2 % | –11.2 | –0.7 |
Note: The FDA‑approved dose for chronic weight management in the United States is 2.4 mg, but many international protocols, including those used by Semaglutide Medship, employ the 1 mg formulation as the maintenance dose.
3.2 Variability Among Participants
Responder range: approximately 30 % achieve > 20 % weight loss, while another 20 % lose < 5 %. Influencing factors include baseline BMI, adherence, and lifestyle coaching. Medications such as steroids can blunt outcomes.
3.3 Additional Metabolic Improvements
Beyond the visual transformation, participants reported systolic blood‑pressure reductions (average –4 mm Hg), triglyceride decreases (average –15 mg/dL), and quality‑of‑life score improvements of about 20 % on the IWQOL‑Lite questionnaire.
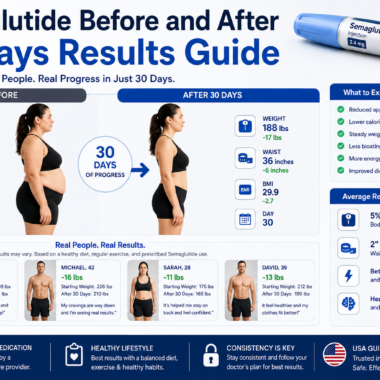
4. Real‑World Before‑After Stories
4.1 Case A: Early Changes (Weeks 4‑12)
Profile: 38‑year‑old female, BMI = 33 kg/m², no diabetes.
Dose: Started with Semaglutide 0.25 mg Pen for 4 weeks, then escalated to 0.5 mg.
Progress: After 6 weeks, weight dropped 3 kg (≈ 3 %). Waist reduced 4 cm. Photographs showed modest reduction in abdominal fullness.
Side‑effects: Mild nausea resolved after dose increase.
4.2 Case B: Mid‑Course (Weeks 24‑36)
Profile: 52‑year‑old male, BMI = 37 kg/m², hypertension.
Dose: Standard titration to 1 mg at week 12.
Progress: By week 30, total loss 12 % (≈ 15 kg), waist down 12 cm, BP down 8 mm Hg. Photographs displayed clear reduction in visceral bulk.
Side‑effects: Initial constipation managed with fiber.
4.3 Case C: Long‑Term (Weeks 48‑68+)
Profile: 45‑year‑old female, BMI = 31 kg/m², pre‑diabetes.
Dose: Maintained 1 mg weekly for 16 months.
Progress: Reached 20 % weight loss (≈ 18 kg) at week 68, HbA1c fell from 6.2 % to 5.5 %, lipids improved. Sequential photographs show dramatic contour change.
Side‑effects: No major issues after first 3 months; occasional mild headache resolved with hydration.
These narratives illustrate the spectrum of outcomes and emphasize that medication dose, lifestyle support, and individual biology together shape the “before‑and‑after” picture.
5. The Titration Journey: From 0.25 mg to 1 mg – How Dose Affects Outcomes
5.1 Standard Titration Schedule
| Week Range | Dose (once weekly) | Goal of This Phase |
|---|---|---|
| 1–4 | 0.25 mg – Semaglutide 0.25 mg Pen | Introduce GLP‑1 activity, assess tolerance |
| 5–8 | 0.5 mg – Semaglutide 0.5 mg Pen | Begin noticeable appetite suppression |
| 9 + | 1 mg – Semaglutide 1.0 mg Pen | Achieve full therapeutic effect for weight loss |
The schedule may be extended for patients with persistent nausea; clinicians can hold a dose for one week before resuming titration.
5.2 Expected Weight‑Loss Contribution at Each Step
- 0.25 mg (first month): average 2‑3 % body‑weight reduction, mainly early appetite changes.
- 0.5 mg (months 2‑3): additional 4‑6 % loss as gastric emptying effects strengthen.
- 1 mg (months 4‑12): cumulative 10‑15 % loss, with the steepest decline between months 4‑6.
5.3 Side‑Effect Profile by Dose
| Dose | Common GI Effects | Typical Onset | Typical Duration |
|---|---|---|---|
| 0.25 mg | Mild nausea, occasional hiccups | Days 1‑3 | Resolves within 1 week |
| 0.5 mg | Nausea, early satiety, constipation | Days 2‑5 | Improves by week 3 |
| 1 mg | Nausea (often less severe), diarrhea, possible dyspepsia | Days 3‑7 | Usually subsides by week 4‑5 |
Most side‑effects are transient and can be mitigated with small, low‑fat meals, adequate hydration, and gradual fiber increase.
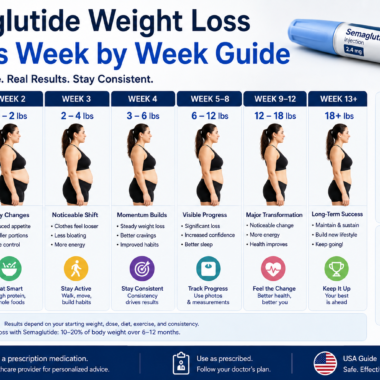
6. Setting Realistic Expectations: Timeline & Plateaus
6.1 Typical Milestones
| Time on Therapy | Expected Clinical Milestone |
|---|---|
| Weeks 1‑4 | Appetite modulation, possible 2‑3 % weight loss, adjustment to injection routine. |
| Weeks 5‑12 | First measurable loss (≈ 4‑6 % of baseline). |
| Weeks 13‑24 | Continued decline; many reach 8‑12 % loss, waist drops 6‑10 cm. |
| Weeks 25‑48 | Approaching 15‑20 % total loss for most adherent patients on 1 mg. |
| Weeks 48‑68+ | Plateau or maintenance; focus shifts to lifestyle integration and metabolic health. |
6.2 Understanding Plateaus
Plateaus are a normal physiological response as the body adapts to lower calorie intake. Contributing mechanisms include adaptive thermogenesis and hypothalamic set‑point adjustments.
Strategies to overcome a plateau:
- Re‑evaluate caloric intake for hidden sources.
- Increase physical activity, especially resistance training.
- Check injection technique and site rotation.
- Discuss dose adjustment; in some regions a higher dose (e.g., 2.4 mg) may be considered.
6.3 Role of Follow‑Up Visits
Regular appointments (every 4‑6 weeks during titration, then every 3 months) allow the care team to review trends, order labs, assess side‑effects, and decide on dose changes or maintenance.
7. Safety, Side‑Effects, and When to Pause or Adjust
7.1 Common Gastrointestinal Effects
| Symptom | Typical Onset | Mitigation Tips |
|---|---|---|
| Nausea | Days 1‑5 | Inject on an empty stomach, eat small low‑fat meals, consider ginger tea. |
| Vomiting | Rare, usually at 0.5 mg | Split missed dose, stay hydrated, contact provider if persistent. |
| Diarrhea | Weeks 2‑4 | Increase soluble fiber, avoid high‑fat foods, consider probiotic. |
| Constipation | Weeks 3‑5 | Hydrate, increase dietary fiber, gentle walking. |
7.2 Contra‑Indications & Precautions
- Personal or family history of medullary thyroid carcinoma (MTC) or Multiple Endocrine Neoplasia type 2 (MEN 2).
- History of pancreatitis.
- Severe renal impairment (eGFR < 30 mL/min/1.73 m²).
- Pregnancy or breastfeeding – safety not established.
7.3 Monitoring Parameters
| Parameter | Frequency | Target/Reference |
|---|---|---|
| Weight, BMI, waist | Weekly (self) / clinic every 4 weeks | Progressive decline; <2 % loss after 12 weeks may prompt review |
| HbA1c | Baseline, 12 weeks, then every 6 months | ≤ 6.5 % for pre‑diabetes; individualized for diabetes |
| Lipid panel | Baseline, 24 weeks, then annually | LDL < 100 mg/dL (or per guideline) |
| Liver & renal function | Baseline, 24 weeks | Within normal limits |
| Thyroid ultrasound (if indicated) | As per specialist recommendation | No evidence of MTC |
7.4 When to Pause or Switch Therapy
- Severe GI intolerance (> 3 days vomiting) – hold for 1 week, then restart at previous tolerated dose.
- Suspected pancreatitis – discontinue immediately and seek urgent evaluation.
- Insufficient weight loss (< 2 % after 12 weeks at 0.5 mg) – discuss dose escalation or adjuncts.
- Pregnancy planning – stop semaglutide at least 2 months before conception.
8. How to Evaluate Your Own Before‑After Progress
8.1 Practical Checklist
| Frequency | Action |
|---|---|
| Daily | Weigh yourself at the same time, record in a log or app. |
| Weekly | Take a waist circumference measurement; note any GI symptoms. |
| Monthly | Capture a standardized photo (front, side, back) using the same lighting and clothing. |
| Every 12 weeks | Review labs (HbA1c, lipids) and discuss with your provider. |
| Every visit | Bring your weight log, photo series, and symptom diary. |
8.2 Using a Health‑Care Team
- Pharmacist – injection technique, medication questions, drug‑interaction checks.
- Physician/Endocrinologist – lab interpretation, dose decisions, contraindication monitoring.
- Registered Dietitian – individualized meal plans that complement appetite suppression.
- Behavioral Coach or Psychologist – address emotional eating patterns.
8.3 Deciding on Dose Escalation or Change
Discuss dose escalation if any of the following occur:
- Weight loss < 2 % after 12 weeks on 0.5 mg (and side‑effects are tolerable).
- Plateau for > 8 weeks with no change in lifestyle variables.
- Desire for greater metabolic improvement (e.g., further HbA1c reduction).
Conversely, severe or persistent GI symptoms may warrant a temporary dose reduction or pause.
Conclusion
Semaglutide provides a powerful, clinically validated tool for chronic weight management, and the “before‑and‑after” narrative—captured through photos, weight charts, and laboratory trends—offers a tangible way for patients to see their progress. Evidence from the STEP trials and real‑world case reports shows that most adults achieve a 15 %‑20 % reduction in body weight after roughly 68 weeks when the medication is titrated to the 1 mg maintenance dose and combined with lifestyle support.
Key points to remember:
- Start low and go slow; titration minimizes side‑effects while unlocking full potential.
- Document consistently with the same scale, tape measure, lighting, and clothing.
- Monitor safety through regular labs, symptom diaries, and scheduled follow‑ups.
- Partner with a multidisciplinary team to translate numerical “after” into lasting health benefits.
If you are considering semaglutide as part of a medically supervised weight‑management plan, discuss with a qualified health‑care professional to determine whether the medication, dosing schedule, and support services align with your personal health goals and medical history. With the right approach, the “before‑and‑after” picture can become a source of empowerment rather than just a visual snapshot.
This article is for educational purposes only and does not replace individualized medical advice.
Frequently Asked Questions
What does “semaglutide before and after” usually show in clinical studies?
In phase‑3 trials, adults who received the approved 1 mg weekly dose lost an average of 15–20 % of their baseline body weight after 68 weeks, with noticeable reductions in waist circumference and improvements in HbA1c and lipid levels. Individual results vary, and visual “before‑and‑after” photos often reflect a combination of weight loss, body‑shape change, and tighter clothing.
How long does it take to see the first visible changes after starting semaglutide?
Most patients notice a modest drop of 0.5–1 kg per week during the first 8–12 weeks, which can translate into a slimmer appearance around the abdomen and hips. Consistent weekly dosing and early titration (0.25 → 0.5 → 1 mg) help minimize side‑effects and allow the appetite‑suppressing effect to take hold.
Does the dose of semaglutide affect the “before‑and‑after” outcome?
Yes. Lower starting doses (0.25 mg) are used to improve tolerability, but the full weight‑loss potential is typically realized at the 1 mg weekly dose. Higher doses provide stronger GLP‑1 receptor activation, leading to greater average weight reductions.
What measurements should I track to create an accurate “before‑and‑after” record?
Combine objective data (weight, BMI, waist circumference, and quarterly labs) with standardized photographs taken at the same time of day, lighting, and clothing. Using the same calibrated scale and measuring tape each visit reduces variability and makes progress easier to interpret.
Can lifestyle changes influence the results shown in semaglutide before‑and‑after photos?
Absolutely. Structured nutrition counseling, regular physical activity, and behavioral coaching amplify the medication’s effect, often resulting in faster and more sustained weight loss. Patients who integrate these supports tend to achieve larger reductions in waist circumference and better metabolic outcomes.
Are “before‑and‑after” pictures reliable for assessing safety?
Photos illustrate body‑shape change but do not capture potential side‑effects. Regular clinical monitoring—including blood pressure, renal function, and gastrointestinal tolerance—is essential, regardless of how impressive the visual results appear.
What should I do if my “before‑and‑after” progress stalls?
A plateau is common after the initial rapid loss phase. Discuss dose adjustment, review dietary intake, evaluate physical activity levels, and ensure labs are within target ranges with your prescribing clinician. Small tweaks in timing of meals or injection site rotation can sometimes re‑activate weight‑loss momentum.